Understanding planned vs. actuals
Comparing what was allocated and what actually happened
Written By Matti Parviainen
Last updated About 1 month ago
Planned vs. actuals (often abbreviated PvA) is the comparison between what you expected to happen and what actually happened. It is one of the most important analytical concepts in Operating because it connects your resource plans to real outcomes — in hours, revenue, and cost.
This article explains what each side of the comparison means, how Operating calculates the numbers, and how to interpret the results so you can take action.
The two sides of the comparison
Every project in Operating has two data streams running in parallel:
Planned hours and cost come from allocations; planned revenue depends on billing type. When you assign a person to a project and create an allocation (e.g., "Adam, 100%, March–June"), Operating uses that allocation to calculate planned hours, planned revenue, and planned cost for that period.
Actual values come from time entries. When Maria tracks her hours in the timesheet, those time entries generate earned revenue, tracked costs, and actual hours.
The difference between planned and actual values is the variance. Variance tells you whether work is going as expected, or whether something needs attention.
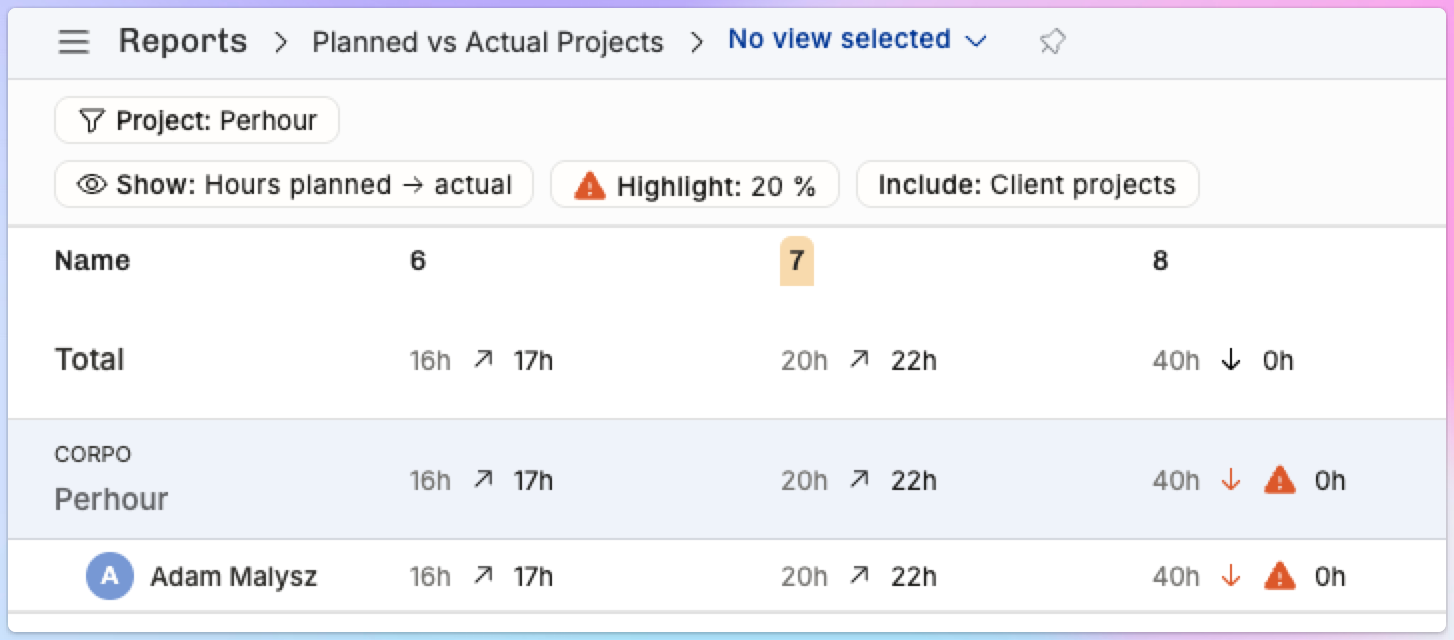
Here’s what a Projects PvA report might look like for a one-person project across three weeks:
What Operating calculates on each side
Hours
The simplest comparison. Planned hours come from allocations: the allocation percentage multiplied by the person's working hours over the allocation's date range. Actual hours come from time entries logged against the project.
If Maria is allocated at 100% and works 8 hours per day, a month with 22 working days produces 176 planned hours. If she tracks 160 hours that month, the variance is −16 hours.
Revenue
For time-and-materials projects, planned revenue is calculated from allocations using the applicable billing rate (from the rate card or a position-specific rate). Earned revenue comes from time entries, also using the applicable billing rate.
For fixed-price projects, planned revenue depends on the budget and the revenue recognition method you've selected. Earned revenue is determined by the project's recognition method — weighted by hours and rates (optionally with manual budget progress), evenly by month or week, or cost-to-cost.
For non-billable projects, revenue is always zero on both sides.
Cost
Planned cost takes each allocation and multiplies the planned hours by the person's cost rate (their hourly cost to the company). Tracked cost does the same calculation but uses actual hours from time entries instead of planned hours from allocations.
Cost comparisons help you understand profitability: is this project costing more to deliver than you planned?
What is a "projected" value?
Operating also provides projected values, which combine both sides of the comparison into a single forward-looking estimate.
A projected value uses actual data up to today and planned data from today onwards. For example, projected cost for a project combines the tracked costs from time entries recorded so far, plus the planned costs from remaining allocations through the end of the project.
This gives you the best current estimate of the final outcome. If you're halfway through a project and actuals are running 20% over plan, the projected total will reflect that trend for the remaining work.
Confirmed and tentative allocations
In the planned vs. actuals report, planned values reflect confirmed allocations only. Tentative allocations (tentative deals, staffing plans that haven't been finalized) are tracked separately and don't appear in the planned column — use the allocation status filter to bring tentative work into the view when you need it.
This is by design. Most consulting firms want to see the full picture of committed and potential work when forecasting. However, keep this in mind when interpreting PvA reports: a large planned-vs-actual gap on a tentative project may simply mean the project hasn't started yet, not that something went wrong.
In reports, you can filter by allocation status (confirmed or tentative) to isolate one or the other if needed.
How to interpret variances
A variance can go in two directions, and the interpretation depends on what you're comparing.
Hours: actual < planned. The team logged fewer hours than allocated. This might mean the project is behind schedule, people were pulled to other work, or the original estimate was too generous.
Hours: actual > planned. The team logged more hours than allocated. Common causes: scope creep, underestimated complexity, or people working on tasks not captured in the allocation plan.
Revenue: earned < planned. You're earning less than expected. For time-and-materials projects, this typically tracks with hours. For fixed-price projects, this could mean budget progress is behind or that the revenue recognition method is producing different results than expected.
Cost: tracked > planned. The project is costing more than planned to deliver. This directly impacts gross profit and margin.
Variance is not inherently good or bad — it depends on context. A project that finishes under budget on hours might mean the team was efficient, or it might mean scope was cut. PvA data surfaces the signal; you supply the interpretation.
Where the numbers come from: a summary
Practical examples
A time-and-materials project running over
A senior developer is allocated at 50% for four months. Based on a billing rate of 165 EUR/h and roughly 80 hours per month (50% of full-time), planned revenue is about 13,200 EUR/month. After two months, their time entries show they've been averaging 100 hours/month, not 80. Earned revenue is running ahead of plan, which is good for revenue, but their cost is also higher. If the client has a budget ceiling, this pace might exhaust the scope early. The PvA variance flags this so you can adjust the allocation or have a conversation with the client.
A fixed-price project behind on delivery
A fixed-price project has a 120,000 EUR budget covering five months. Revenue recognition is set to "weighted by hours and rates." After three months, only 40% of the planned hours have been tracked, meaning earned revenue is around 48,000 EUR against a planned ~72,000 EUR. The variance shows the project is behind schedule. The project owner investigates: are people working on the right tasks? Was the estimate too aggressive? Should the timeline be extended?
A healthy project with minimal variance
A project manager is allocated at 25% across two projects. Their planned hours roughly match their tracked hours each month, and the small variance is explained by a public holiday that reduced working days. This is the outcome you want — plans and reality are aligned.
Related concepts
Gross profit is the difference between revenue and cost. You can calculate it from planned values (planned gross profit) or actual values (actual gross profit). PvA helps you see whether profitability is tracking as expected.
Utilization measures the percentage of a person's time spent on productive work. Planned utilization comes from allocations; actual utilization comes from time entries. PvA on a per-person basis is essentially a utilization comparison.
Revenue recognition determines how fixed-price project revenue is recorded over time. The recognition method you choose directly affects the "earned revenue" side of PvA for fixed-price projects.
Further reading
Introduction to Financials — how to configure rate cards and cost rates that drive PvA calculations
How to set up rate cards — how billing rates are determined
How to set up cost rates — how cost rates are set up
Budgeting and profitability: a worked example — budgets, margins, and financial tracking for projects